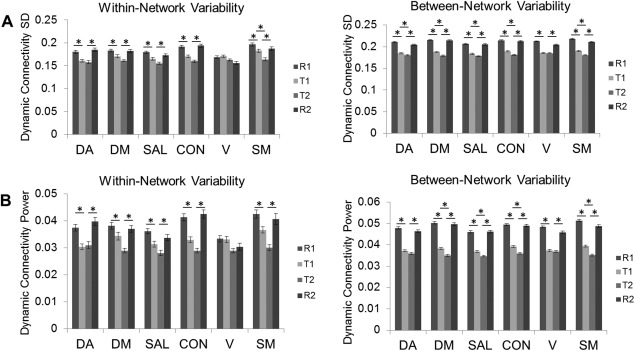
Figure 3.

Bar plots of the effect of task on network FCV. The effect of task on the (A) standard deviation (SD) and (B) power of sliding window connectivity time series are presented for within‐network and between‐network ROIs. Error bars represent standard error of the mean. Asterisks denote significant differences between consecutive scans.
