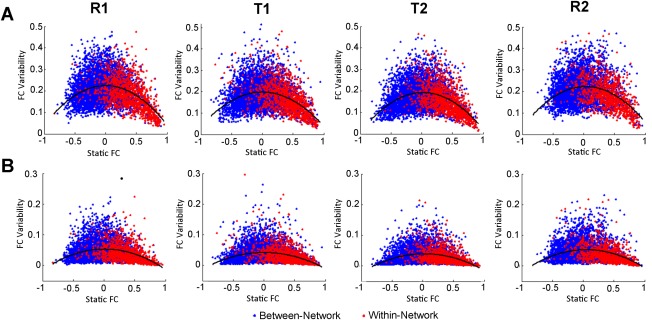
Figure 5.

Scatter plots of the relationship of static functional connectivity and connectivity variability for all networks. Variability was measured using the (A) standard deviation (SD) and (B) power of sliding window functional connectivity. FC, functional connectivity. [Color figure can be viewed in the online issue, which is available at http://wileyonlinelibrary.com.]
