
Figure 2.
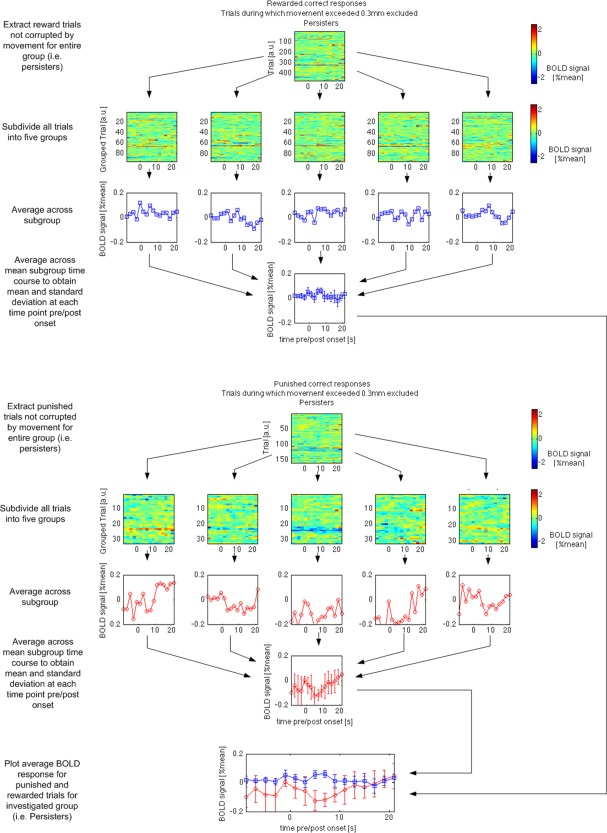
Trial‐by‐trial averaging approach taken to process the group data on the example observed in the left nucleus accumbens in persisters for rewarded and punished correct responses. Please note that the signal variations at approximately 5 to 9s after stimulus onset were significantly different for the two conditions. The difference was measured to be as small as 0.1% of the mean MRI signal measured in the same brain tissue while the variation in the single trial data is up to 2% of the mean MRI signal (trial‐by‐trial maps with color bar). [Color figure can be viewed in the online issue, which is available at http://wileyonlinelibrary.com.]