
Figure 4.
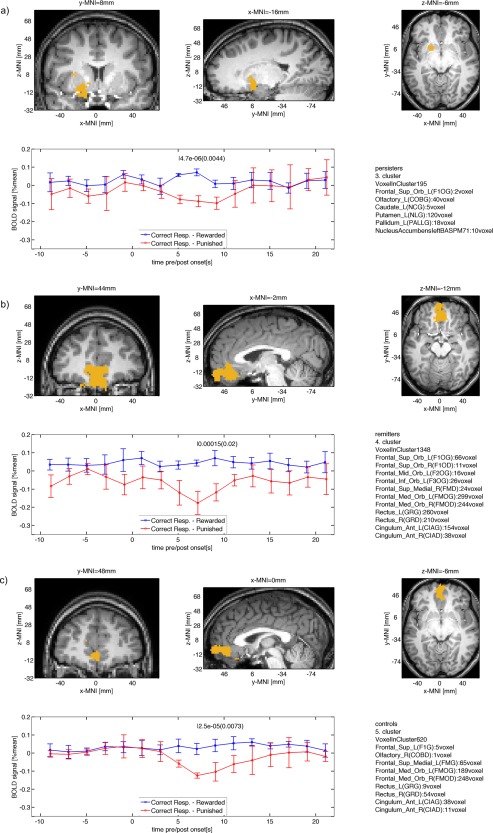
Clusters for within group differences between BOLD signals after reward and punishment (P < 0.05, cluster‐level FWE corrected) for (a) persisters, (b) remitters, and (c) controls. Note that remitters and controls show significant contrast in frontal cortex, while persisters show significant contrast in the striatum. [Color figure can be viewed in the online issue, which is available at http://wileyonlinelibrary.com.]