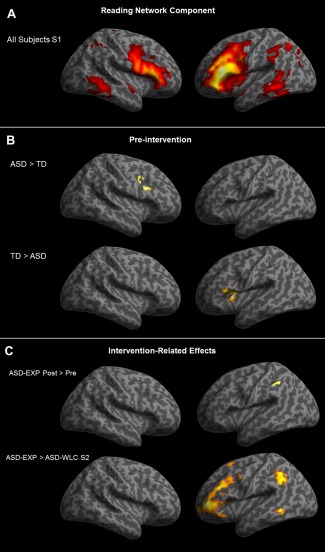
Figure 1.

(A) The independent component with the highest spatial correlation with our reading network mask derived from all subjects combined (TD + ASD‐EXP + ASD‐WLC groups; n = 53) at the first imaging session (FWE corrected at P < 0.05). (B) Between‐group differences in within‐network connectivity for all ASD combined at the first imaging session (ASD‐EXP + ASD‐WLC groups) versus TD group (P < 0.001, FDR corrected). (C) Intervention related effects: Top panel: Between‐group analysis showing greater network connectivity at postintervention than perintervention for the ASD‐EXP group; bottom panel: Between group analysis showing greater network connectivity in the ASD‐EXP group compared to the ASD‐WLC group at the second imaging session. Maps are thresholded at P < 0.001, FDR corrected. [Color figure can be viewed in the online issue, which is available at http://wileyonlinelibrary.com.]
