
Figure 5.
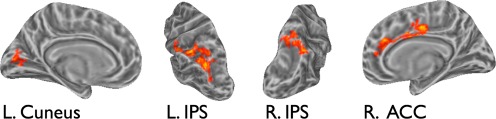
Areas where responses to visual series varied with input entropy. These areas exhibited different temporal dynamics during visual series presentation as a function of input entropy. [Color figure can be viewed in the online issue, which is available at http://wileyonlinelibrary.com.]