
Figure 6.
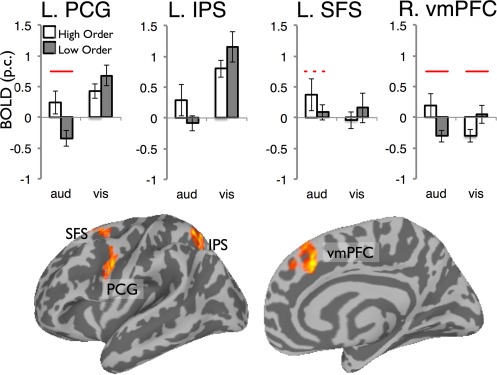
Areas where activity for the highly structured and random series varied as a function of series modality. These regions were identified by an analysis probing for a 2 (entropy: high, low) × 2 (modality) interaction on the whole‐brain level. The clusters identified were treated as functional regions of interest and the mean activity in each region is shown in bar graphs. Solid lines indicate statistically significant difference between entropy levels (P < 0.05) and the dotted line a marginally significant difference (P = 0.06). [Color figure can be viewed in the online issue, which is available at http://wileyonlinelibrary.com.]