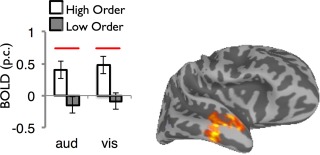
Figure 7.

Modality‐general coding of input entropy in the right anterior temporal cortex. This region showed a main effect of entropy that was not modulated by an Entropy × Modality interaction. The center of mass of the cluster in Talairach coordinates: 54, −15, −18. Solid lines indicate statistically significant difference between entropy levels (P < 0.05). [Color figure can be viewed in the online issue, which is available at http://wileyonlinelibrary.com.]
