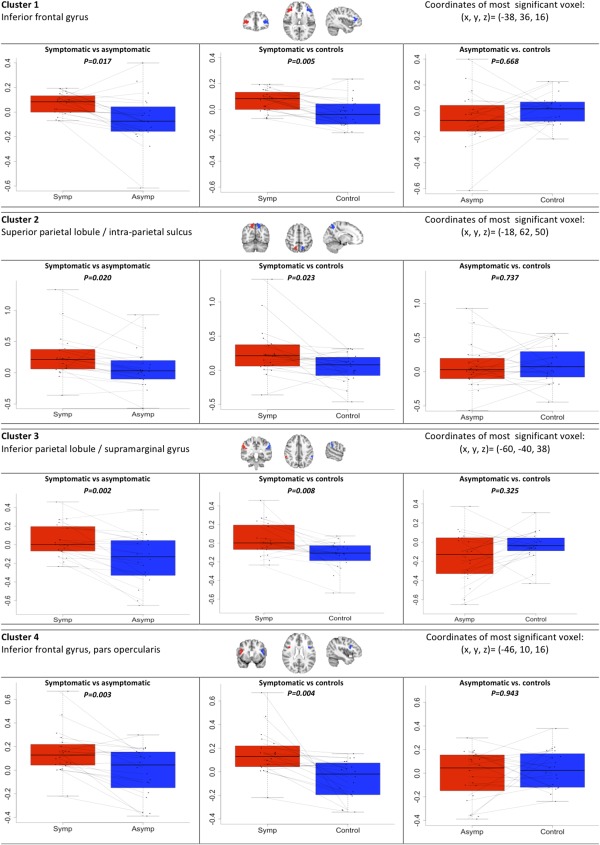
Figure 3.

ROI‐based results from extracted clusters. The fMRI‐BOLD activation levels in the four significant clusters of activation from the voxel‐wise comparison of symptomatic and asymptomatic patient hemispheres. For each cluster a comparison of symptomatic hemispheres (symp) to the contralateral asymptomatic hemispheres (asymp) within patients is shown. Also shown are comparisons of the symptomatic and asymptomatic patient hemispheres to hemispheres of matched healthy control subjects. Activation levels were compared using paired T tests corrected for multiple comparison using the sequential Bonferroni correction after Holm. Values on y‐axes are median percentual BOLD signal changes during activation. [Color figure can be viewed in the online issue, which is available at http://wileyonlinelibrary.com.]
