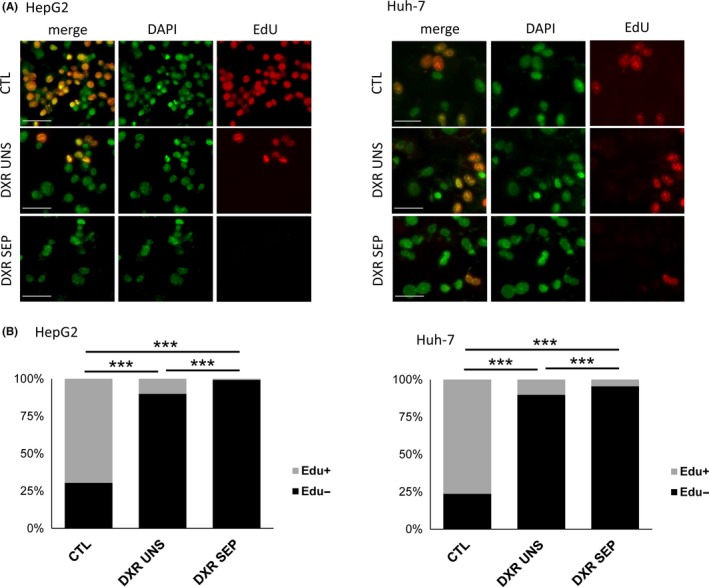
Figure 3.

Growth inhibition in HepG2 and Huh‐7 cells treated with 100 nM doxorubicin (DXR) for 48 h followed by 5 d washout. (A and B) EdU staining of HepG2 and Huh‐7 cells. (A) Representative micrographs showing DAPI, EdU and merged labelling in control (CTL) and DXR‐treated cells, separated (SEP) or not (UNS) by gradient‐based centrifugation. (B) Quantification of EdU staining intensity. The proportion of Edu‐positive cells as in (A) was calculated over a total of ~1300 cells per condition. n = 3‐4. **P < .01; ***P < .001
