
Figure 2.
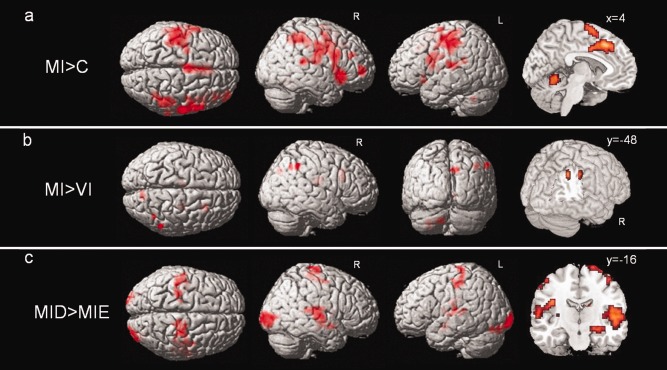
Activation in the whole subject group (n = 20) during: (a) MI versus control (C), displayed at a threshold of P(unc) < 0.001, k > 20. (b) MI versus VI, displayed at P(unc) < 0.005, k > 20. (c) Difficult (MID) versus easy (MIE) paths during MI, at P(unc) < 0.001, k > 20.