
Figure 4.
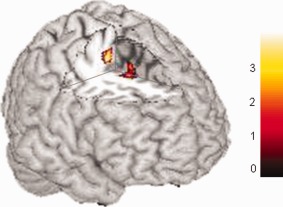
Good versus bad imagers, for the contrast targeting precise control of gait (MID > MIE), displayed at P(unc) < 0.001. Both clusters are in the right SMA (see Table 3). [Color figure can be viewed in the online issue, which is available at http://wileyonlinelibrary.com.]