
Figure 1.
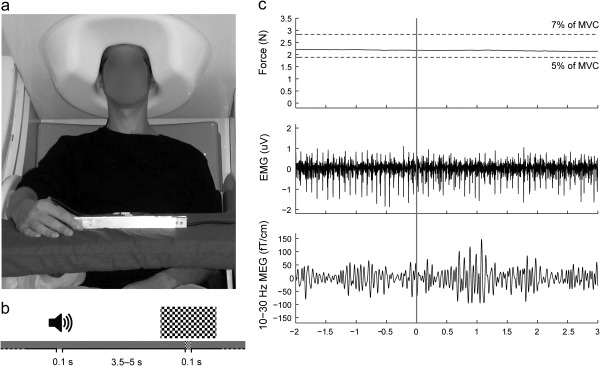
Experimental setup and representative signals of subject S1. (a) Position of the subject during MEG recording. (b) Stimuli: auditory (binaural 1‐kHz tones for 0.1 s) and visual (checkerboard pattern for 0.1 s) stimuli randomly presented every 3.5–5 s. (c) Examples of the measured signals as a function of time, shown for a 5‐s epoch of isometric contraction. Rows from top to bottom: force (the horizontal dashed lines indicate the task limits, 5–7% of maximum voluntary contraction), wide‐band EMG and 10–30‐Hz MEG (from the channel showing the highest CMC). The grey vertical band indicates the occurence of auditory stimulus.