
Figure 3.
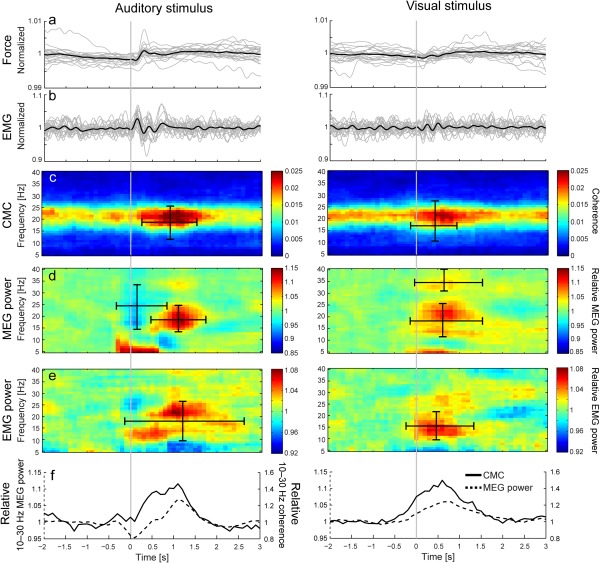
Results of the stimulus‐related analysis for 20 subjects. (a and b) Normalized group‐level (black line) and individual (grey lines) force (a) and EMG (b) values low‐pass filtered at 5 Hz. (c–e) Group‐level time‐frequency CMC (c), MEG power (d) and EMG power maps (e). (f) Relative modulations of 10–30‐Hz CMC (solid line) and MEG power (dashed line). The CMC and MEG power maps were computed for a single gradiometer that showed the strongest coherence in the subject's left M1 cortex (corresponding to right hand). Ranges of statistically significant enhancements and suppressions are indicated with horizontal (time) and vertical (frequency) bars superimposed on the map (c–e). All maps and values are time‐locked to the onset of auditory (1st column) or visual (2nd column) distractors, indicated by the grey vertical lines. The stimulus‐related force and EMG traces were normalized by their mean values. Please note that due to the method used to compute coherence and power, values at a given time‐point reflect signals ±0.5 s around. For this reason, modulation in coherence and power are already visible before the stimulus onset.