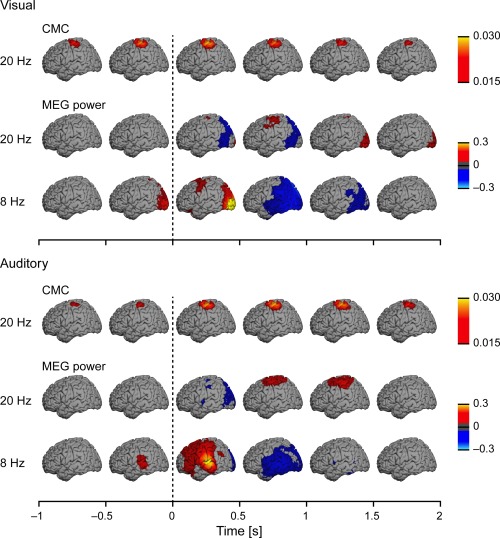
Figure 4.

Source reconstructions at the group level (n = 20) separately for the coherence at the frequency bin corresponding to 19.5 Hz (first row) and for the relative MEG power at 19.5 and 7.8 Hz (second and third row). Each map was computed as the mean coherence/power across time‐bins spanning the 0.5‐s time window above which it is centered on (e.g., maps displayed above the 0–0.5‐s time‐window reflect the mean of the 6 maps computed at 0, 0.1, 0.2, 0.3, 0.4, 0.5 s). Other details as in Figure 3.
