
Figure 4.
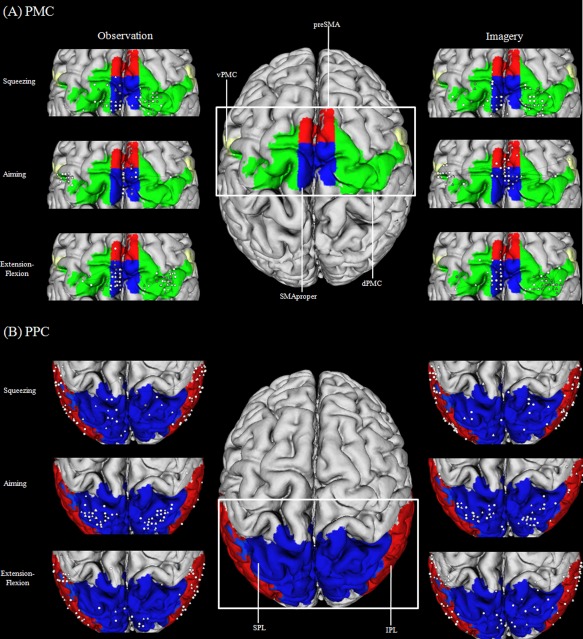
Illustration of the individual local maxima for hand and foot movements (squeezing, aiming, extension–flexion) in the PMC (A) and the PPC (B): triangles represent hand maxima, circles represent foot maxima. White indicates a t value above t = 1.96 and gray indicates a t value below t = 1.96.