
Figure 2.
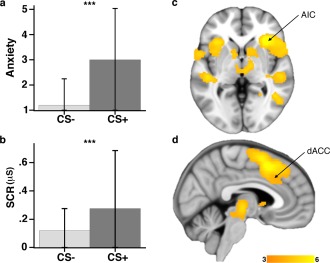
(a) In‐scanner ratings of self‐reported anxiety sensations—scale ranging 1 = “not anxious” to 5 = “very anxious.” (b) Offline skin conductance responses during fear conditioning (SCR; µS) acquired at Week 2. Mean and standard deviations are displayed. (c) Whole‐brain FDR‐corrected activation during fear conditioning emphasizing responses in the right AIC; and (d) dACC. Color‐bar activation magnitude corresponds to SPM T values. [Color figure can be viewed in the online issue, which is available at http://wileyonlinelibrary.com.]