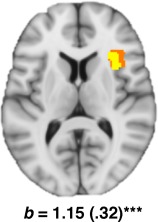
Figure 4.

Right AIC cluster identified as a significant path b effect from the primary ROI analysis. MNI co‐ordinates (x, y, z): path b (32, 22, 8). Voxels emphasized yellow correspond to q < 0.05 (FDR) with those in orange representing subthreshold contiguous voxels (P < 0.05). [Color figure can be viewed in the online issue, which is available at http://wileyonlinelibrary.com.]
