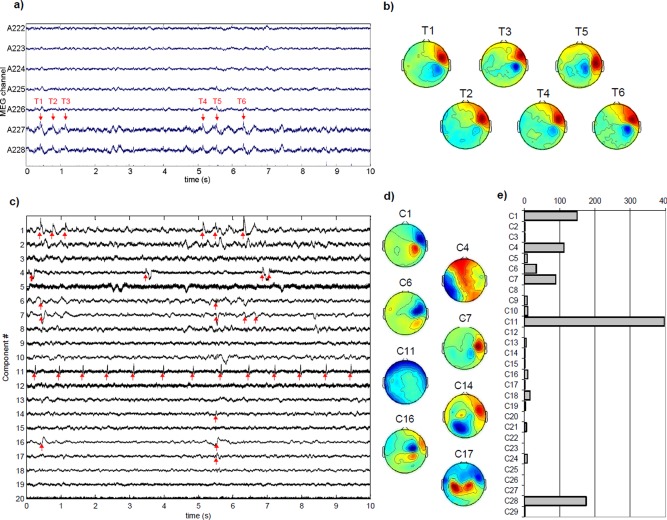
Figure 1.

(a) Example of seven channels of original MEG data with visible spikes (patient 1, only 10 s are shown). (b) Topographies at selected time stamps (T1–6) (c) ICA time courses on the same section (only first 20 components are shown). Spike detections are marked with red arrows. Clear interictal spikes can be seen on components 1, 6, 7, and 16. Component 11 corresponds to cardiac artifact. (d) Corresponding spatial components (only a selection is shown). Components 1, 6, and 7 have clear dipolar patterns that correspond to one main source. Component 17 is indicative of bilateral brain sources. (e) Histogram of spike detections on ICA components. The higher number of spikes corresponds to the cardiac artifact (component 11). Components 1, 4, 6, 7, and 28 present a large number of detected spikes compared with the other components. [Color figure can be viewed in the online issue, which is available at http://wileyonlinelibrary.com.]
