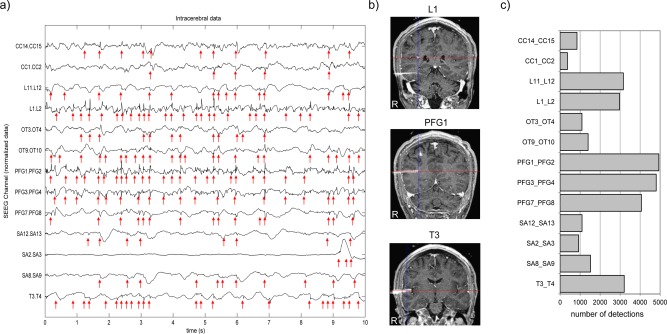
Figure 2.

(a) An example of intracerebral EEG (SEEG) data (only 10 s and selected channels are shown), Patient 1. Spike detections are marked with red arrows. One can readily observe that spike density in SEEG is higher than in MEG. (b) Registration of CT scan and MRI showing the position of three electrodes out of six. (c) Histogram of spike detections. The selected contacts on electrodes PFG, T and L show a higher number of spikes than contacts from other electrodes. [Color figure can be viewed in the online issue, which is available at http://wileyonlinelibrary.com.]
