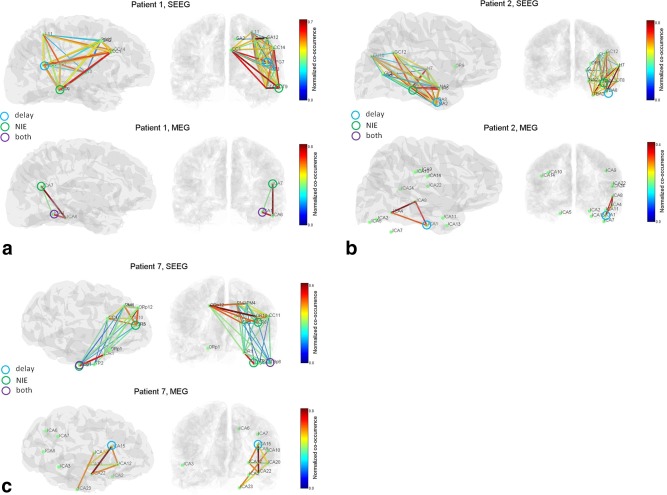
Figure 3.

Interictal co‐occurrence networks in SEEG and MEG for three patients. Leading nodes are shown with circles, in the sense of the delay measure, the NIE measure, or both. (a) Patient 1. The SEEG graph is more extended than the MEG graph, but share common regions in the parieto‐occipital junction and posterior temporal lobe. One leading node is consistent across modalities (temporal posterior region). (b) Patient 2. SEEG and MEG network share the posterior temporal regions, and a leader in the lower temporal region with good concordance in the location. (c) Patient 7. The general structure of the SEEG network is seen in MEG (basal temporal–frontal network). Only one SEEG leader is identified in MEG. [Color figure can be viewed in the online issue, which is available at http://wileyonlinelibrary.com.]
