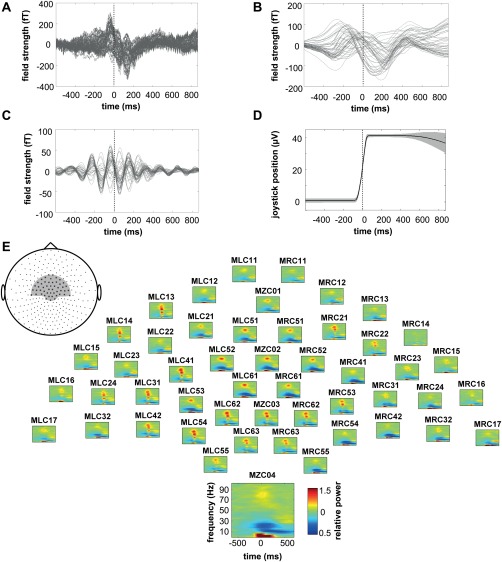
Figure 2.

Task‐related modulation of brain activity. (A) Exemplary raw MEG signals of the 50 sensors used to build the classifier from the CS 1–6 of subject 12. Vertical line indicates point of data alignment at 50% of maximum joystick deflection. (B) Same signals after 1.6 Hz low‐pass (LP) and (C) 4–6 Hz band‐pass (BP) filtering. (D) Absolute joystick position within the same time period. (E) Corresponding topographic display of relative power spectra for the same set of MEG sensors (grey inset). Data represent the average over all CS trials of all 14 subjects; one sensor is magnified for better visualization.
