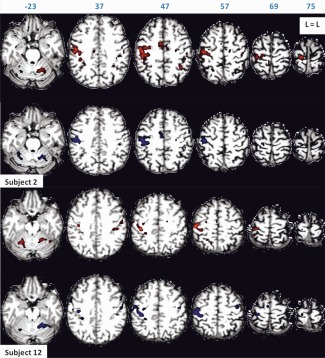
Figure 1.

Motor task activation of Subjects 2 and 12 for scan Session 1 (in red) and scan Session 2 (in blue), rendered on subject's anatomy, in turn resliced in MNI space. Axial slices are shown in neurological orientation (left is left) with the corresponding coordinate on top of each slice. Z‐values for activated voxels exceeding the threshold (P < 0.05 corrected) ranged from 5.1 to 19.3 for scan Session 1, and from 5.1 to 18.7 for scan Session 2 for Subject 2. Z‐values ranged from 5.1 to 16.3 for scan Session 1, and from 5.1 to 20.5 for scan Session 2 for Subject 12. [Color figure can be viewed in the online issue, which is available at http://wileyonlinelibrary.com.]
