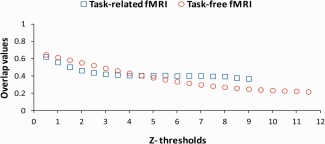
Figure 4.

Between session averaged across all subjects overlap values for task (depicted by blue open squares) and task‐free (depicted by red open circles) fMRI for different thresholds based on Z‐values. The maximum Z‐value present in all subjects and sessions was 9 for task, and 11.5 for task‐free fMRI. [Color figure can be viewed in the online issue, which is available at http://wileyonlinelibrary.com.]
