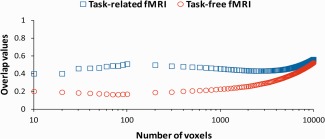
Figure 5.

Between session averaged across subjects overlap values for task (depicted by blue open squares) and task‐free (depicted by red open circles) fMRI for different supra‐threshold voxels (range 10–10,000 voxels). The x‐axis is scaled logarithmically. [Color figure can be viewed in the online issue, which is available at http://wileyonlinelibrary.com.]
