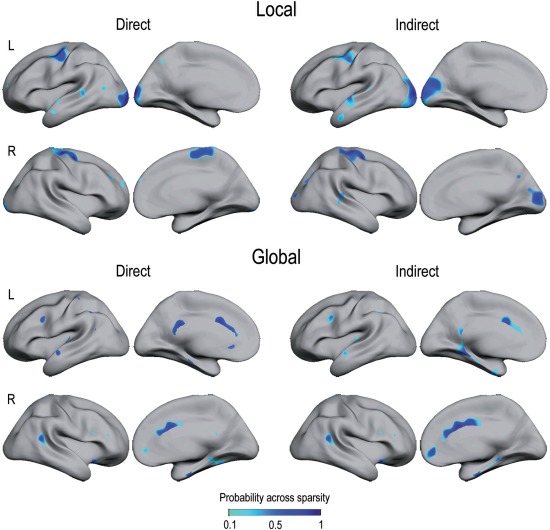
Figure 3.

Overlapping of local and global hubs in structural and functional cortical networks. Overlapped hubs (based on node degree) were split into those with the highest number of direct connections (left column) and the highest number of indirect pathways (right column) in structural and functional networks, separately. The color scale represents the proportion of sparsities showing overlapped local/global hubs in both cortical networks. Note that overlapped local hubs were mostly allocated over unimodal association areas, whereas global hubs mainly appeared over heteromodal association areas. L = left; R = right.
