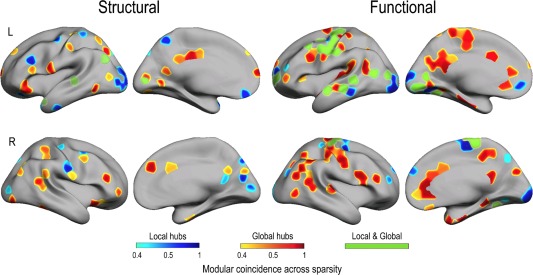
Figure 4.

Regional distribution of cortical modules overlapping local (blue scale) and global hubs (red scale) in structural and functional networks. The color scale represents proportions for a modular node reached the hub criterion (node degree) across sparsities. Those modular nodes overlapping both local and global hubs are represented in green. L = left; R = right.
