
Figure 6.
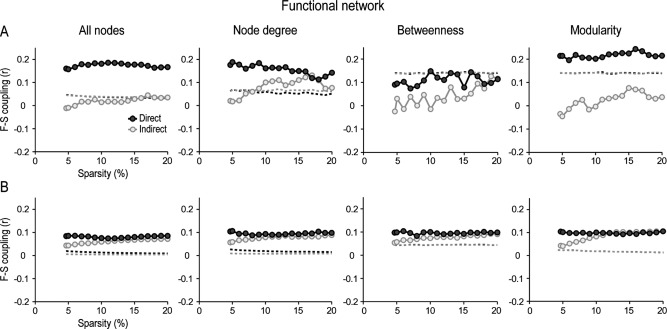
Functional‐structural (F‐S) coupling as a function of node attributes and intrinsic properties of functional network connections. F‐S coupling was displayed for direct (dark‐grey circles) and indirect connections (light‐grey circles) for cortical regions communicated through both local (A) and global interactions (B) across different levels of sparsity in the functional network. This analysis was performed for all nodes in the network, and for those nodes with either high centrality (based on node degree or betweenness) or high modularity. Dashed lines represent the statistical threshold (p <0.05) for each condition. Values above the dashed line represent significant F‐S correlations.