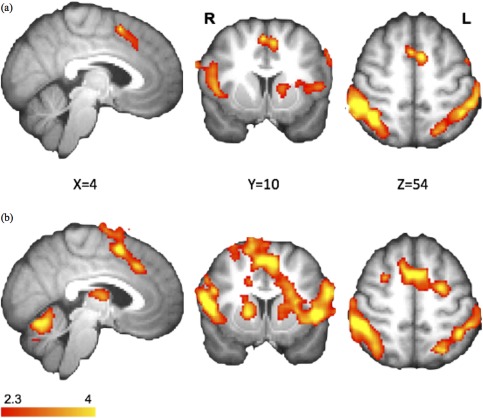
Figure 3.

Similar stopping networks in the Stop > rest contrast. Details are summarized in Table 3. (a) In the sham condition, the regional activations were similar to the SI > Go contrast. (b) Increased BOLD response within the stimulation site (FZ, especially preSMA). Results were corrected for multiple comparisons using cluster‐based thresholding (z = 2.3, P < 0.05). [Color figure can be viewed in the online issue, which is available at http://wileyonlinelibrary.com.]
