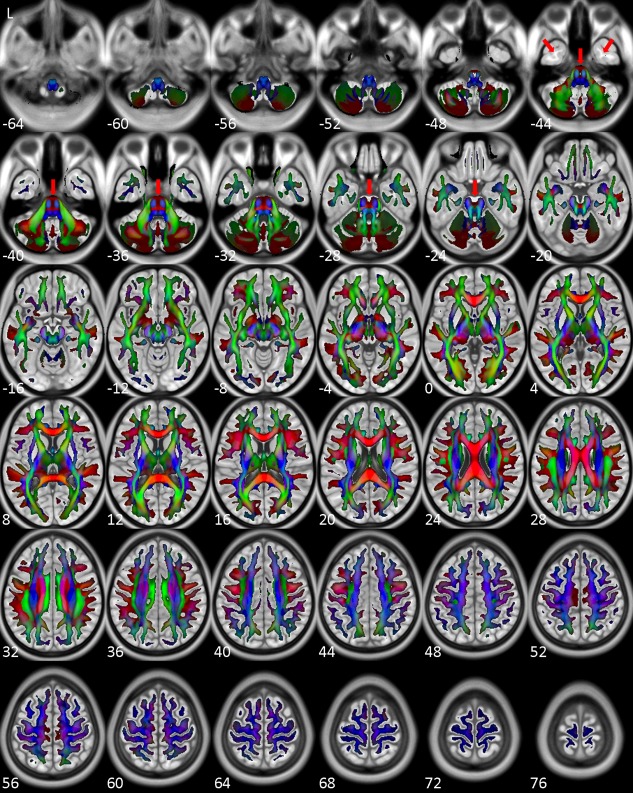
Figure 2.

Directionally color‐coded (by the orientations corresponding to the maximal ODF values) GFA map of NTU‐DSI‐122. Regions shown here are those with GFA values greater than 0.1. The background is ICBM‐152‐T1 indexed by the z coordinates (in millimeter) in the ICBM‐152 space. Red arrows indicate slight mismatch between the GFA map and ICBM‐152‐T1. [Color figure can be viewed in the online issue, which is available at http://wileyonlinelibrary.com.]
