
Figure 1.
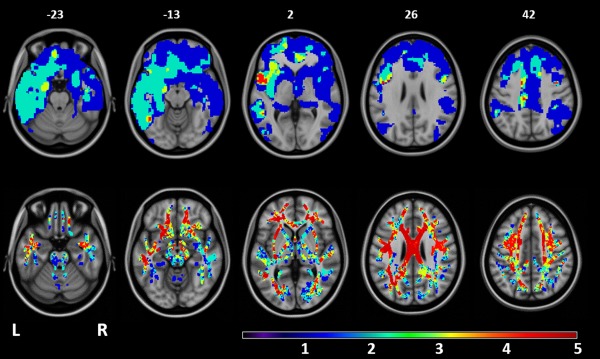
Overlapping patterns of GM atrophy and WM damage among FTLD syndromes (with the exception of MND cases with a pure motor syndrome). Top row: areas of overlapping GM atrophy relative to healthy controls. Bottom row: areas of overlapping decreased FA relative to healthy controls. Patients with behavioral variant of FTD, MND with cognitive and/or behavioral impairment, nonfluent/agrammatic and semantic PPA variants, and PSPs showed significant results relative to healthy controls (see Supporting Information figures). The resulting areas of GM atrophy or FA decrease were overlaid on the axial slices of the T1‐weighetd template in the MNI standard space (numbers are Z coordinates). Color scale indicates the number of patient groups showing GM atrophy or FA decrease relative to healthy controls in each voxel (ranging from 0 to 5 groups). Regions in red are those showing damage in all the clinical phenotypes with the exception of MND cases with a pure motor syndrome.