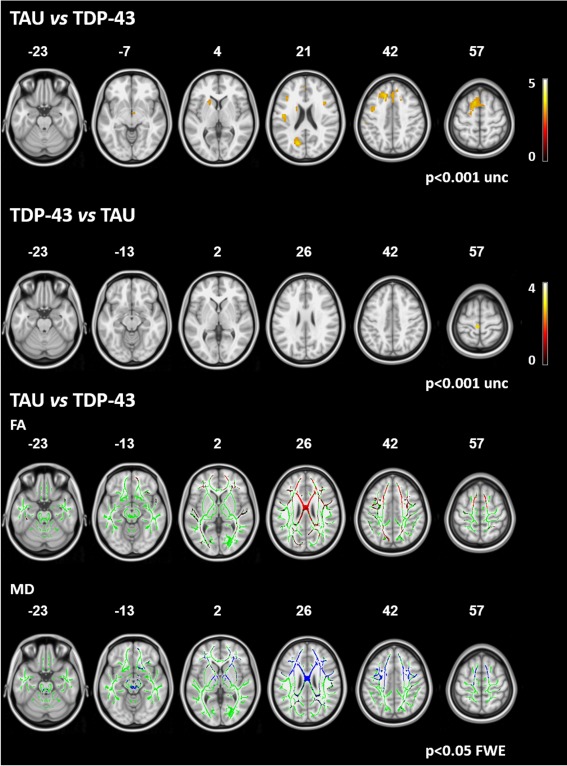
Figure 2.

Between‐pathology comparison. Upper two rows: areas of GM atrophy in patients with probable TAU pathology compared with patients with likely TDP‐43 pathology and viceversa. Results are overlaid on the axial sections of a T1‐weighted template in the MNI standard space in neurological convention (left is left) and displayed at P < 0.001 uncorrected (numbers are Z coordinates). The color scale indicates T‐values. Bottom two rows: areas of significant increased mean diffusivity (MD, in blue) and decreased fractional anisotropy (FA, in red) in patients with likely TAU pathology compared with patients with likely TDP‐43 pathology. The results are overlaid on the axial sections of a FA template in the MNI standard space in neurological convention (left is left), and displayed at P < 0.05 FWE‐corrected (numbers are Z coordinates). The WM skeleton is shown in green.
