
Figure 3.
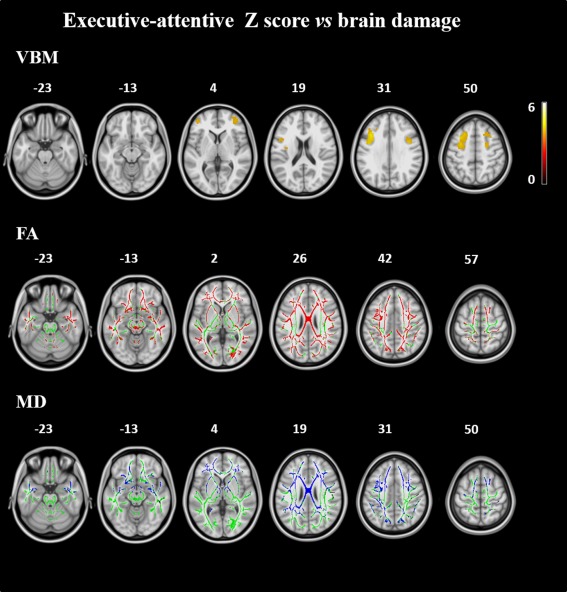
Correlation analysis. Upper row: GM volumes correlating with the executive‐attentive Z score across the FTLD spectrum. Results are overlaid on the axial sections of a T1‐weighted template in the MNI standard space in neurological convention (left is left) and displayed at P < 0.05, FWE‐corrected (numbers are Z coordinates). The color scale indicates T‐values. Bottom rows: correlations of mean diffusivity (MD, in blue) and fractional anisotropy (FA, in red) values with the executive‐attentive Z score across the FTLD spectrum. The results are overlaid on the axial sections of a FA template in the MNI standard space in neurological convention (left is left), and displayed at P < 0.05, FWE‐corrected (numbers are Z coordinates). The WM skeleton is shown in green.