
Figure 2.
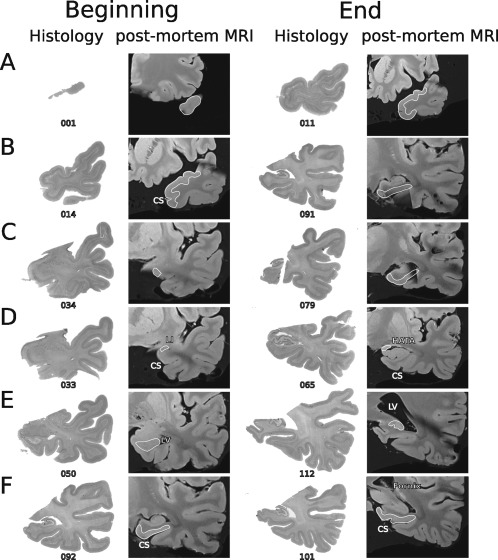
Correspondence between MRI and histology. Example of the correspondence between MTL anatomical landmarks as depicted in post‐mortem MRI scans and neuroanatomical cytoarchitectonic series after processing the same case. Columns from left to right show the beginning (first two columns) and end (last two columns) of each MTL structure on histological sections and on the corresponding post‐mortem T1 MRI slices. Numbers represent the histological section number from the temporal pole (distance between two neighbouring sections: 0.5 mm). (A) Temporopolar cortex, (B) perirhinal cortex, (C) entorhinal cortex, (D) amygdala, (E) hippocampus, (F) posterior parahippocampal cortex. CS, collateral sulcus; LI, limen insulae; LV, lateral ventricle; HATA, hippocampal‐amygdaloid transitional area.