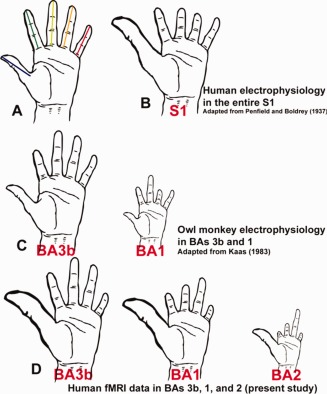
Figure 5.

Schematic representation by different authors of the size of cortical finger representations in different species. The size of the cortical representations of each finger is indicated by the length of that finger. All finger sizes are plotted onto a human hand. A: Human hand. The colored lines represent for each finger the length of the finger that was scaled according to the results from the different studies. B: Single finger representation in human S1 as measured with intraoperative stimulation in humans (Penfield and Boldrey, 1937). C: Single finger representation in owl monkeys for BAs 3b and 1 as measured with electrophysiology (Kaas, 1983). The hand sizes were scaled with the size of BAs 3b and 1 reported in the paper. D: Single finger representation in human BAs 3b, 1, and 2 as measured with fMRI in the present study. The hand sizes were scaled with the size of BAs 3b, 1 and 2 measured in this study.
