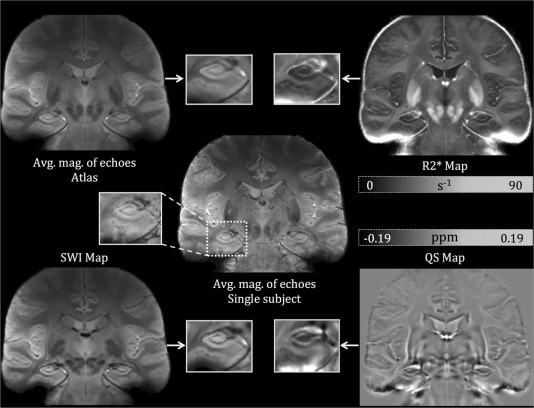
Figure 1.

Single subject (middle) as well as atlas‐based images of average magnitude across echoes (top left), (top right), qualitative SWI (bottom left), and QS maps (bottom right). The adjacent image to each map shows a zoomed‐in representation of a hippocampal slice in the coronal view. The same slice is chosen for all maps to compare CNR and SNR across the different maps.
