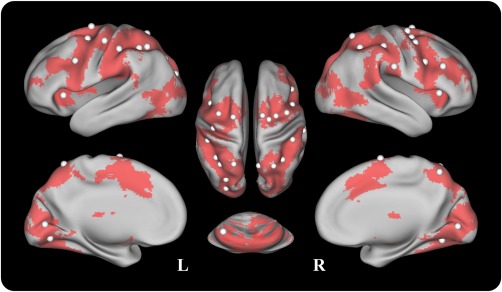
Figure 2.

The node distribution of the working memory network for the background functional network analysis. The 29 ROIs were defined from Power's 264 putative functional regions [Power et al., 2011] and the MNI coordinates of the ROIs are shown in Supporting Information Table S1. The nodes are posted on an inflated surface rendering of the human brain using the CARET program [Van Essen et al., 2001]. [Color figure can be viewed in the online issue, which is available at http://wileyonlinelibrary.com.]
