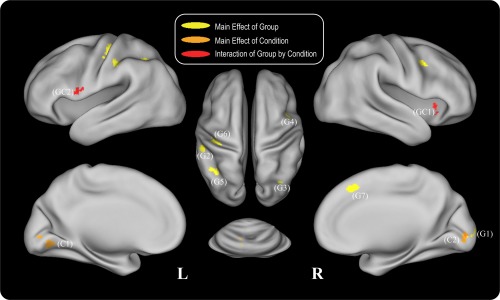
Figure 5.

Repeated ANOVA results for the recognition phase. Areas which showed a main effect of group are depicted in yellow, areas which showed a main effect of difficulty level condition are depicted in orange, and areas which showed an interaction effect of group by condition are depicted in red. The indexed numbers next to the areas correspond to the ROI indices in the post‐hoc analysis in Figure 6. [Color figure can be viewed in the online issue, which is available at http://wileyonlinelibrary.com.]
