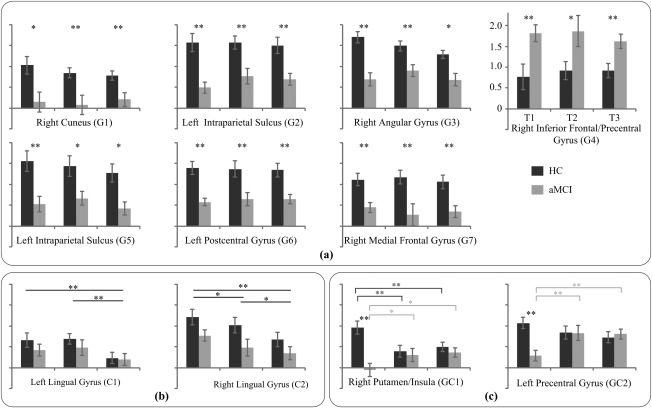
Figure 6.

The average AUC values in the regions with (a) a main effect of group, (b) a main effect of difficulty level, and (c) an interaction of group by condition derived from the ANOVA analysis during the recognition phase (*P < 0.05, **P < 0.01. Error bars reflect the SEM).
