
Figure 1.
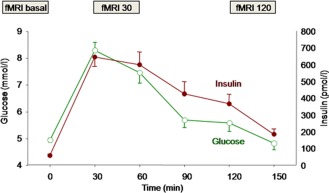
Schematic time points for fMRI measurements, glucose (green open symbols) and insulin (red filled symbols) levels (see also Supporting Information Table 1 for values). [Color figure can be viewed in the online issue, which is available at http://wileyonlinelibrary.com.]