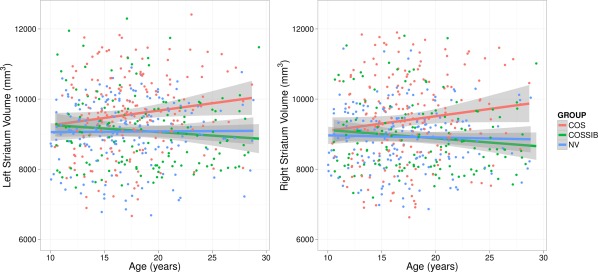
Figure 1.

Striatal volumes over the developmental trajectory for COS, COSSIBs, and NV. Note that all three groups start with the same absolute volumes at the beginning of the developmental trajectory, but the COS group volume through the course of maturation. Shaded areas indicate 95% confidence intervals.
