
Figure 2.
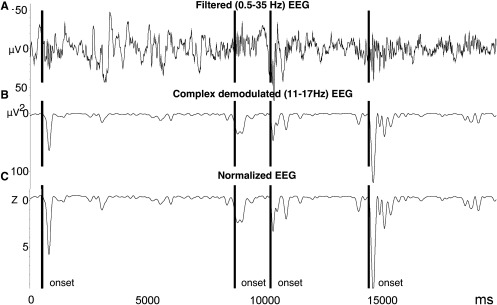
A: Spindle detection method. The raw EEG (0.5 − 35 Hz) was transformed, and power (μV2) was extracted for each data point using a complex demodulation algorithm in the range of 11–17 Hz. Spindle onsets were detected on the normalized, demodulated signal using a Z‐score transformation that employed a 60 s sliding window (used to calculate the mean and standard deviation about each data point). A threshold of z = 3.10 was used, equivalent to the 99.9th percentile (see text for more details).