
Figure 3.
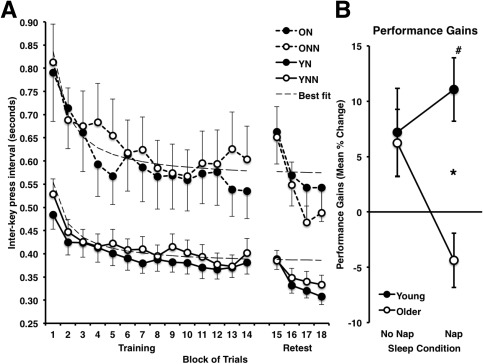
A: Performance speed [interkey press interval (s)] during training (14 blocks) for both young and older participants in the Nap and No‐Nap conditions. Dashed line indicates the mean fitted performance (from individually fitted inverse function: y = C + B/x) at training. B: Performance gains (percent change mean interkey‐press interval) from the end of training (mean last 4 blocks) to the beginning of retest (mean first 4 blocks) for both Young and Older participants in the Nap and No‐Nap conditions. * Indicates significantly greater mean gains in performance (P < 0.05, Holm‐Bonferroni corrected) at retest in Young participants as compared with older participants in the Nap condition. # Indicates significant gain in performance in the Young Nap condition. YN: Young Nap; YNN: Young No‐Nap; ON: Older Nap; ONN: Older No‐Nap.