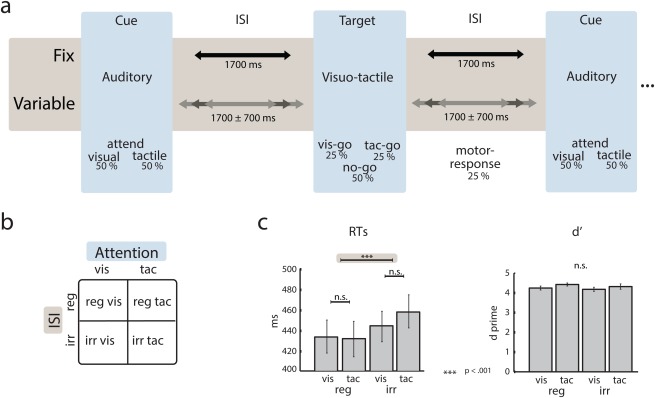
Figure 2.

Illustration of the different experimental conditions and behavioral data. (a) Stimulus train in the regular (upper timeline) and irregular (lower timeline) ISI condition. Auditory cues were followed by an ISI of regular or irregular duration. Following the ISI, a visuo‐tactile stimulus was presented. This stimulus was always bisensory but was either constituting a visual target, a tactile target, or a standard. Participants were instructed to respond with a button press only if a target appeared in the cued modality. The focus of the EEG data analysis was on the interval preceding the visuo‐tactile stimulus. (b) Illustration of the 2 × 2 factorial study design. (c) Median reaction times (left barplot) and d′ values (right barplot) for all four conditions. [Color figure can be viewed in the online issue, which is available at http://wileyonlinelibrary.com.]
