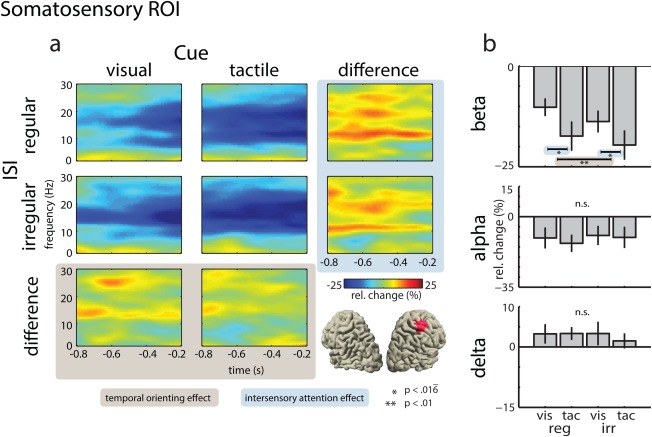
Figure 5.

Power of neural oscillations in the somatosensory ROI. (a) Time‐frequency representations of virtual electrodes for the visual (left panel) and tactile attention conditions (middle panel), and their difference (right panel), for the regular ISI condition (top row), the irregular ISI condition (middle row), and their difference (bottom row). The bottom right panel illustrates the location of the somatosensory ROI in source space. (b) Mean power change for BBA, ABA, and DBA. Effects of temporal orienting are highlighted in ocher and effects of intersensory attention are highlighted in blue. [Color figure can be viewed in the online issue, which is available at http://wileyonlinelibrary.com.]
