Figure 1.

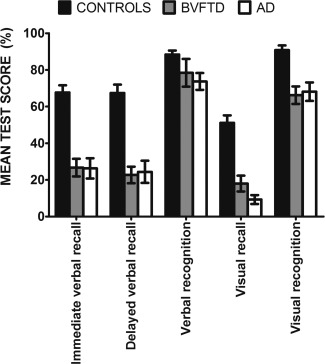
Bar chart showing overall memory performance (percentage correct) across verbal and visual recall and recognition for healthy Controls, behavioral variant FTD and AD participants. Error bars represent standard error of the mean.

Bar chart showing overall memory performance (percentage correct) across verbal and visual recall and recognition for healthy Controls, behavioral variant FTD and AD participants. Error bars represent standard error of the mean.