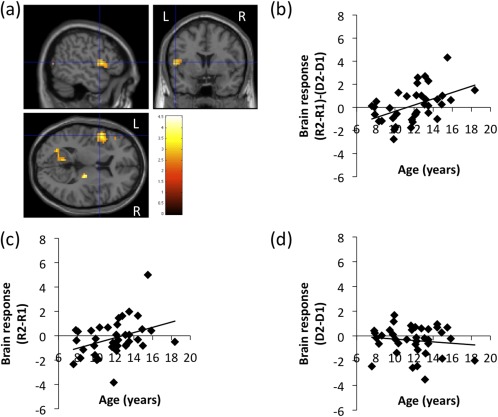
Figure 4.

(a) Increased brain activation in the left inferior frontal gyrus (IFG) pars oparcularis (pOp) during speech sound production in L2 compared with L1 [i.e. (R2 − R1) − (D2 − D1)] as a function of age via regression analyses. A liberal statistical threshold was applied for visualization purposes (P < 0.01, uncorrected for multiple comparisons). The peak of the cluster was P < 0.001 for height and corrected to P < 0.05 for multiple comparisons using cluster size with SVC. Relationship of the brain activation in the left IFG pOp for (b) (R2 − R1) − (D2 − D1) (r = 0.47, P = 0.003), (c) R2–R1 (r = 0.37, P = 0.025), (d) D2–D1 (r = ‐0.12, P = 0.469) as a function of age. A line fitted by linear regression is also plotted in (b), (c), and (d).
