Figure 2.

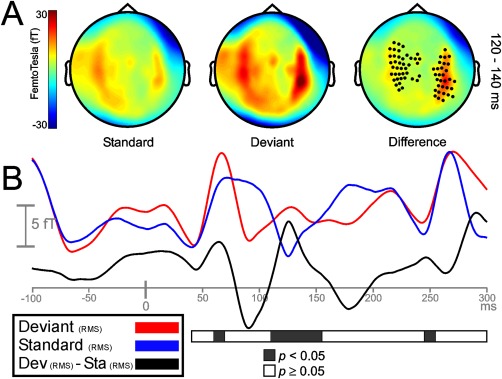
Sensor‐space activity for the local condition during LLR time range. A: The grand average of the topography of magnetic fields (planar transformed) between 120 and 140 ms after sound onset for standard (Sta), deviant (Dev), and their difference (Dev − Sta). Two bilateral clusters of sensors showed a significant increase in response to local frequency deviations (P < 0.05). B: Grand‐averaged RMS waveforms (all sensors, not planar transformed) for deviant (red line), standard (blue line), and its difference RMS time course (black line). Black portions within the horizontal bar representing statistically significant time intervals (P < 0.05; in steps of 20 ms) show enhanced responses to deviant tones between 120 and 160 ms after the onset of the local deviation.
