Figure 1.

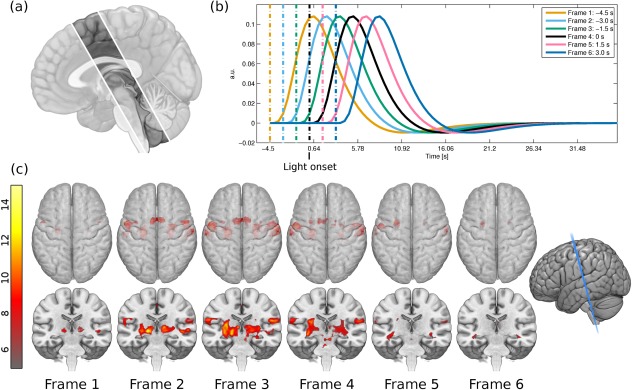
(a) Only seven slices were recorded in the fast EPI measurement, which limited the scanned volume to slices encompassing the PMC, SMA, M1, S1, S2, posterior insula, cerebellum, and brainstem. This image is a graphical representation of the brain covered by the seven slices; the faded parts were not included in the measurement. (b) A plot of the six different HRFs used in the GLM analysis, named Frame 1 through Frame 6 from left to right. Frame 4 represents the light onset. The interrupted lines represent the onset times while the solid lines represent the corresponding HRFs. (c) Statistical parametric maps for the six HRFs used in the GLM analysis. The top row shows the axial view with the rendering made translucent, so that deeper activations can be seen. The bottom row shows a coronal cut, slightly oblique as depicted on the far right. The color bar depicts the t‐score from gray (lowest) to bright yellow (highest). [Color figure can be viewed in the online issue, which is available at http://wileyonlinelibrary.com.]
