
Figure 2.
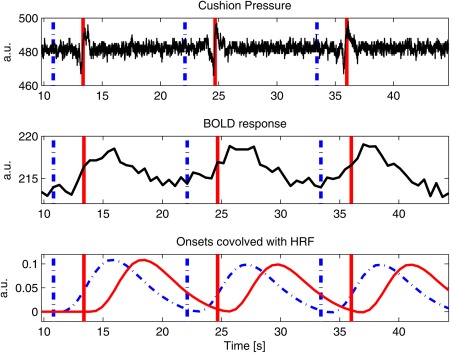
A plot illustrating the pressure cushion signal, BOLD response from the highest activated voxel in M1S1 for a representative subject and onsets convolved with the HRF, plotted against time. All three plots are synchronized in time. Vertical lines indicate onset times for color change (interrupted line) and thyroid cartilage movement (solid line). The HRF aligned with color change (interrupted line) properly corresponds with the BOLD response, as opposed to the HRF aligned with thyroid cartilage movement (solid line). [Color figure can be viewed in the online issue, which is available at http://wileyonlinelibrary.com.]